v19.10
GTRD
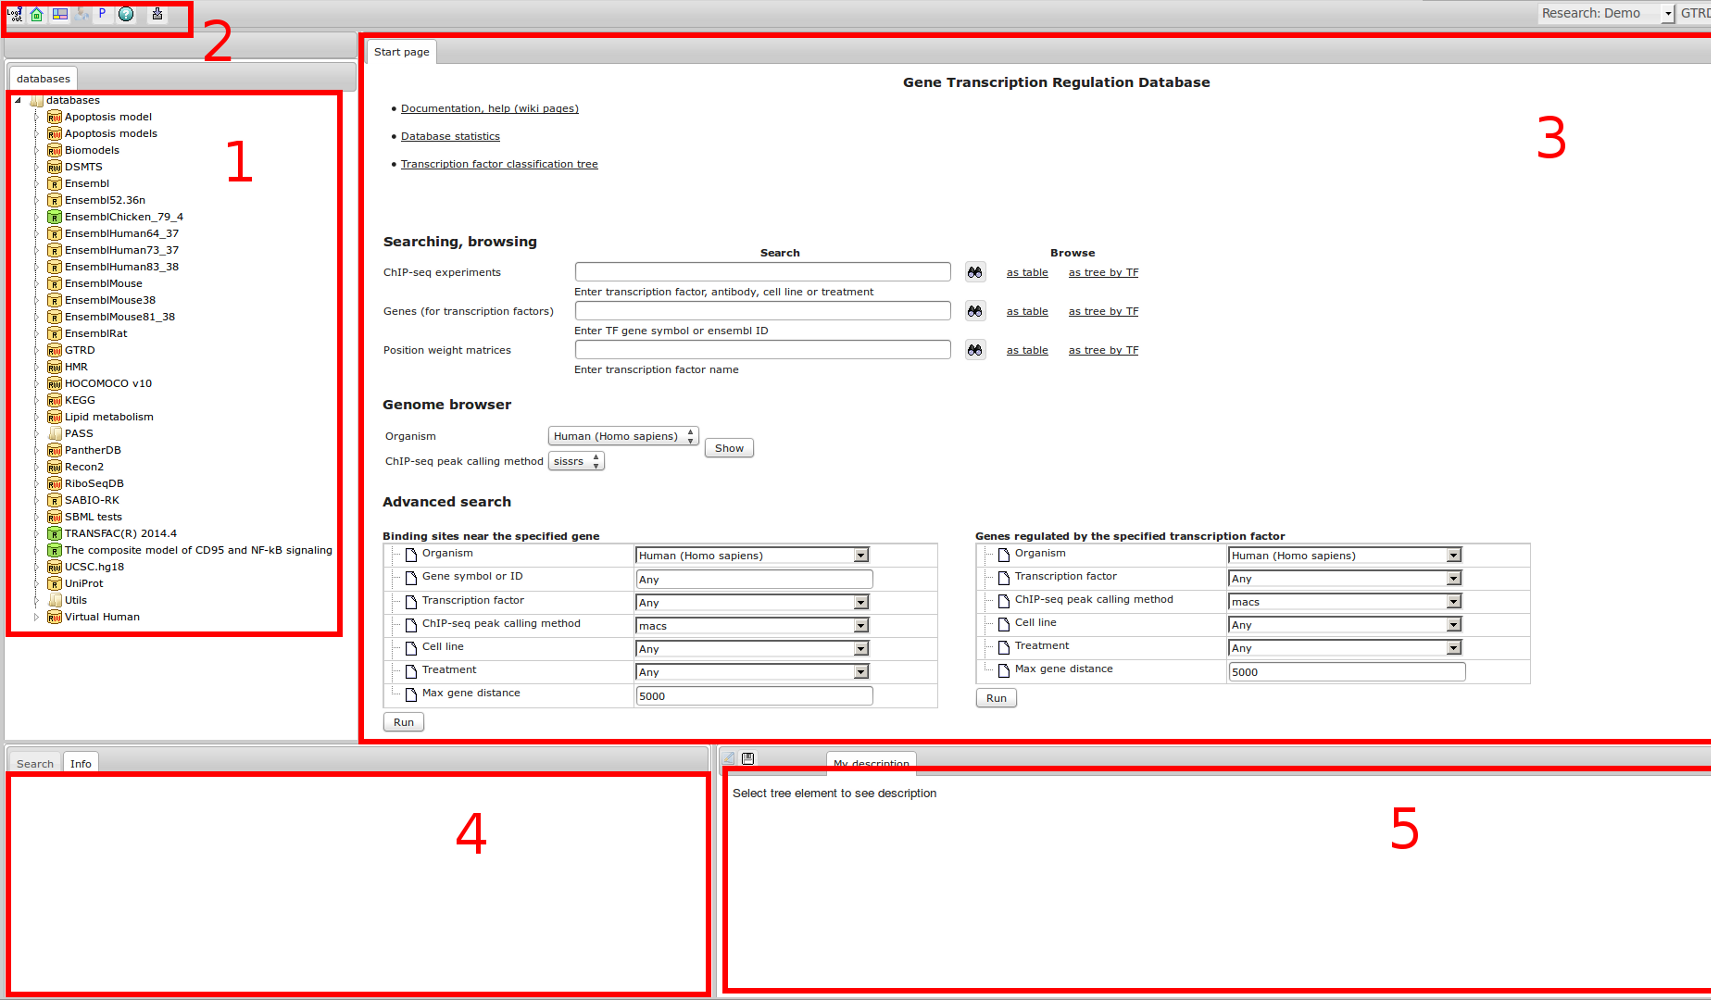
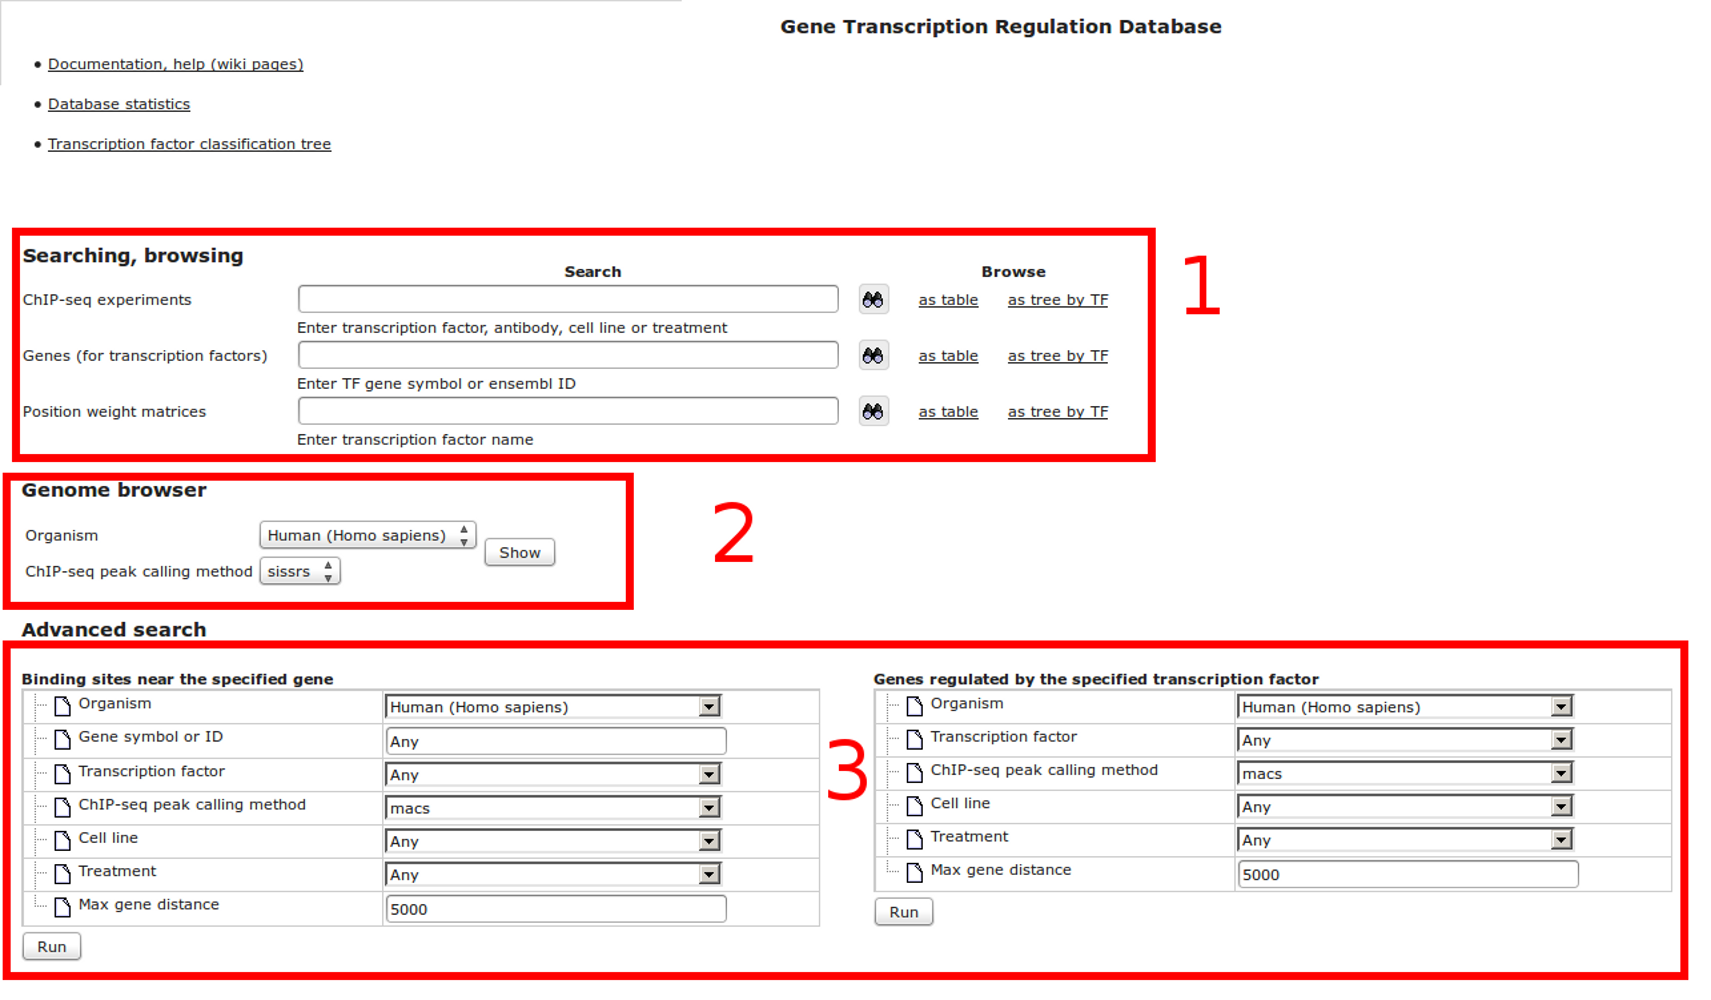
Gene Transcription Regulation Database
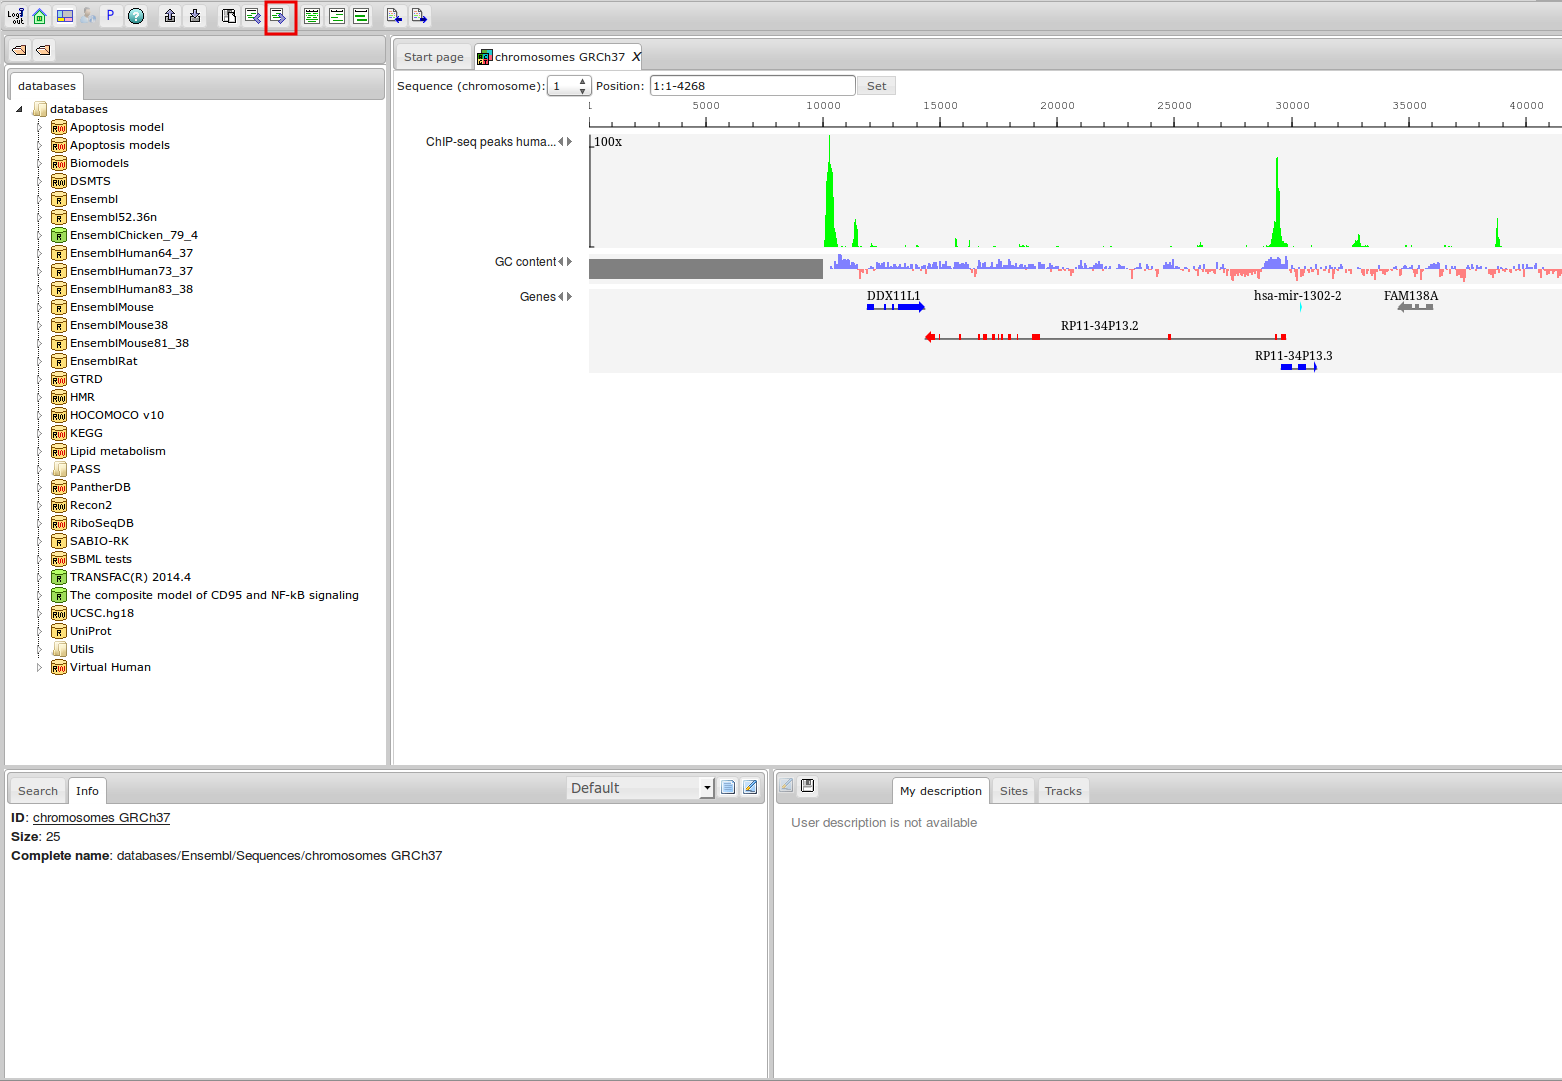
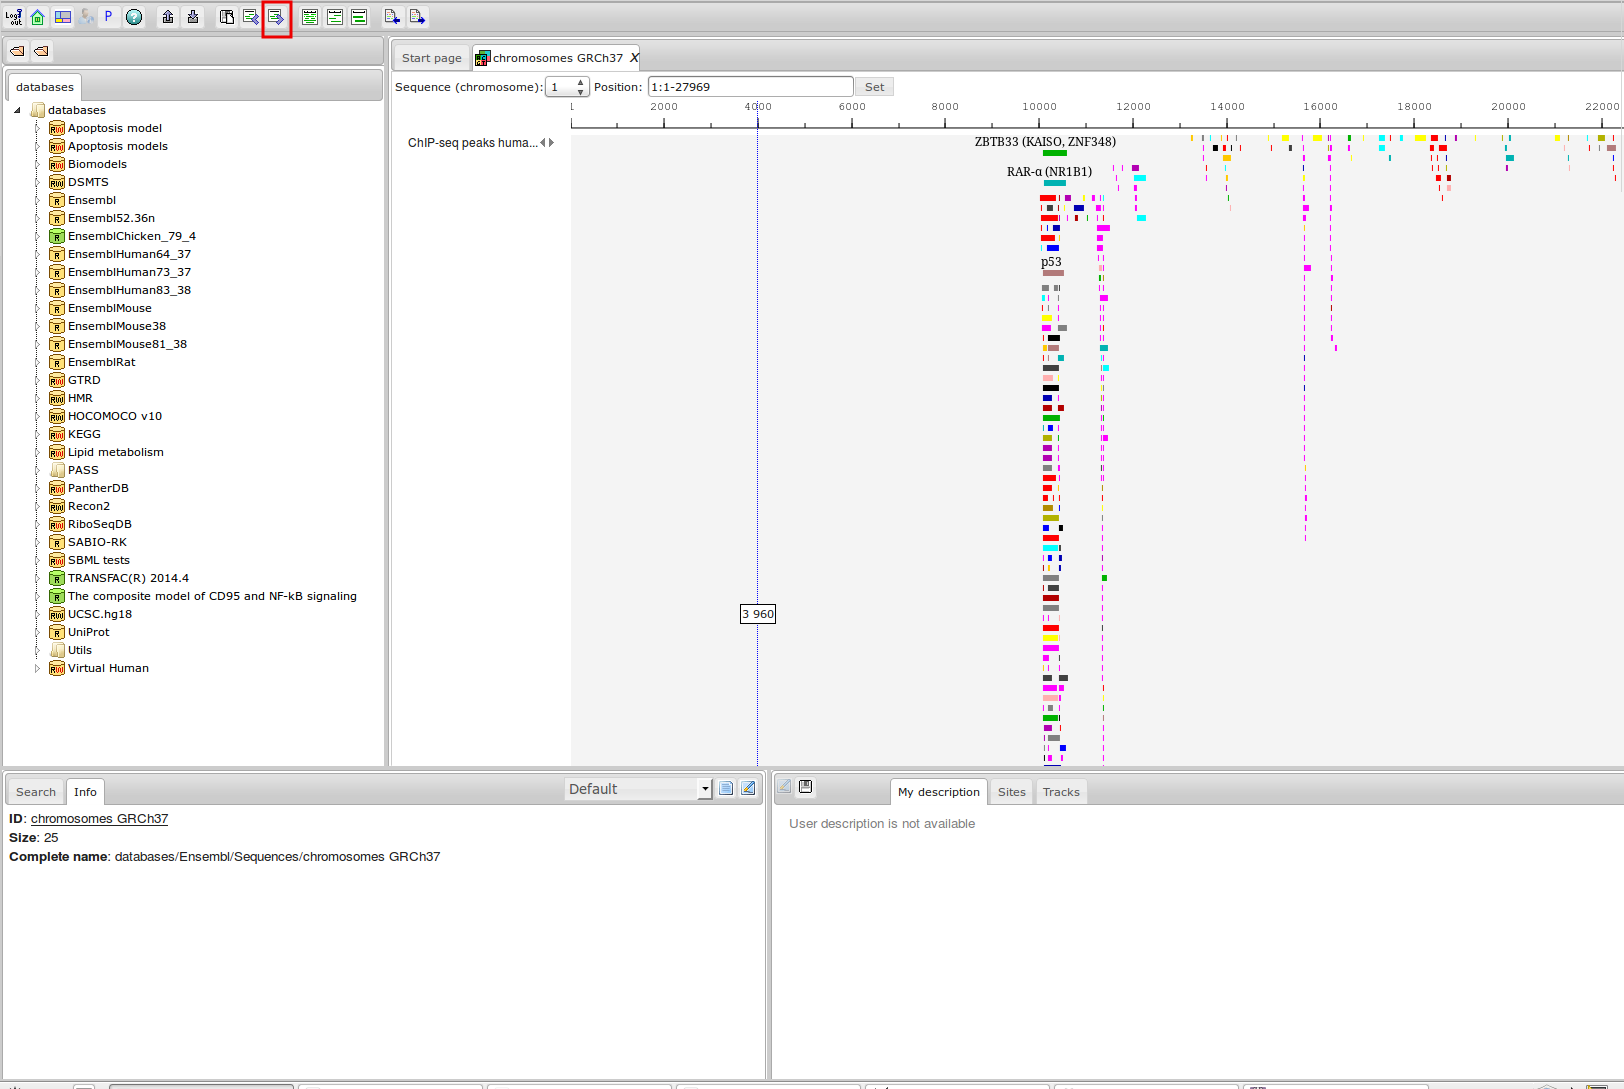
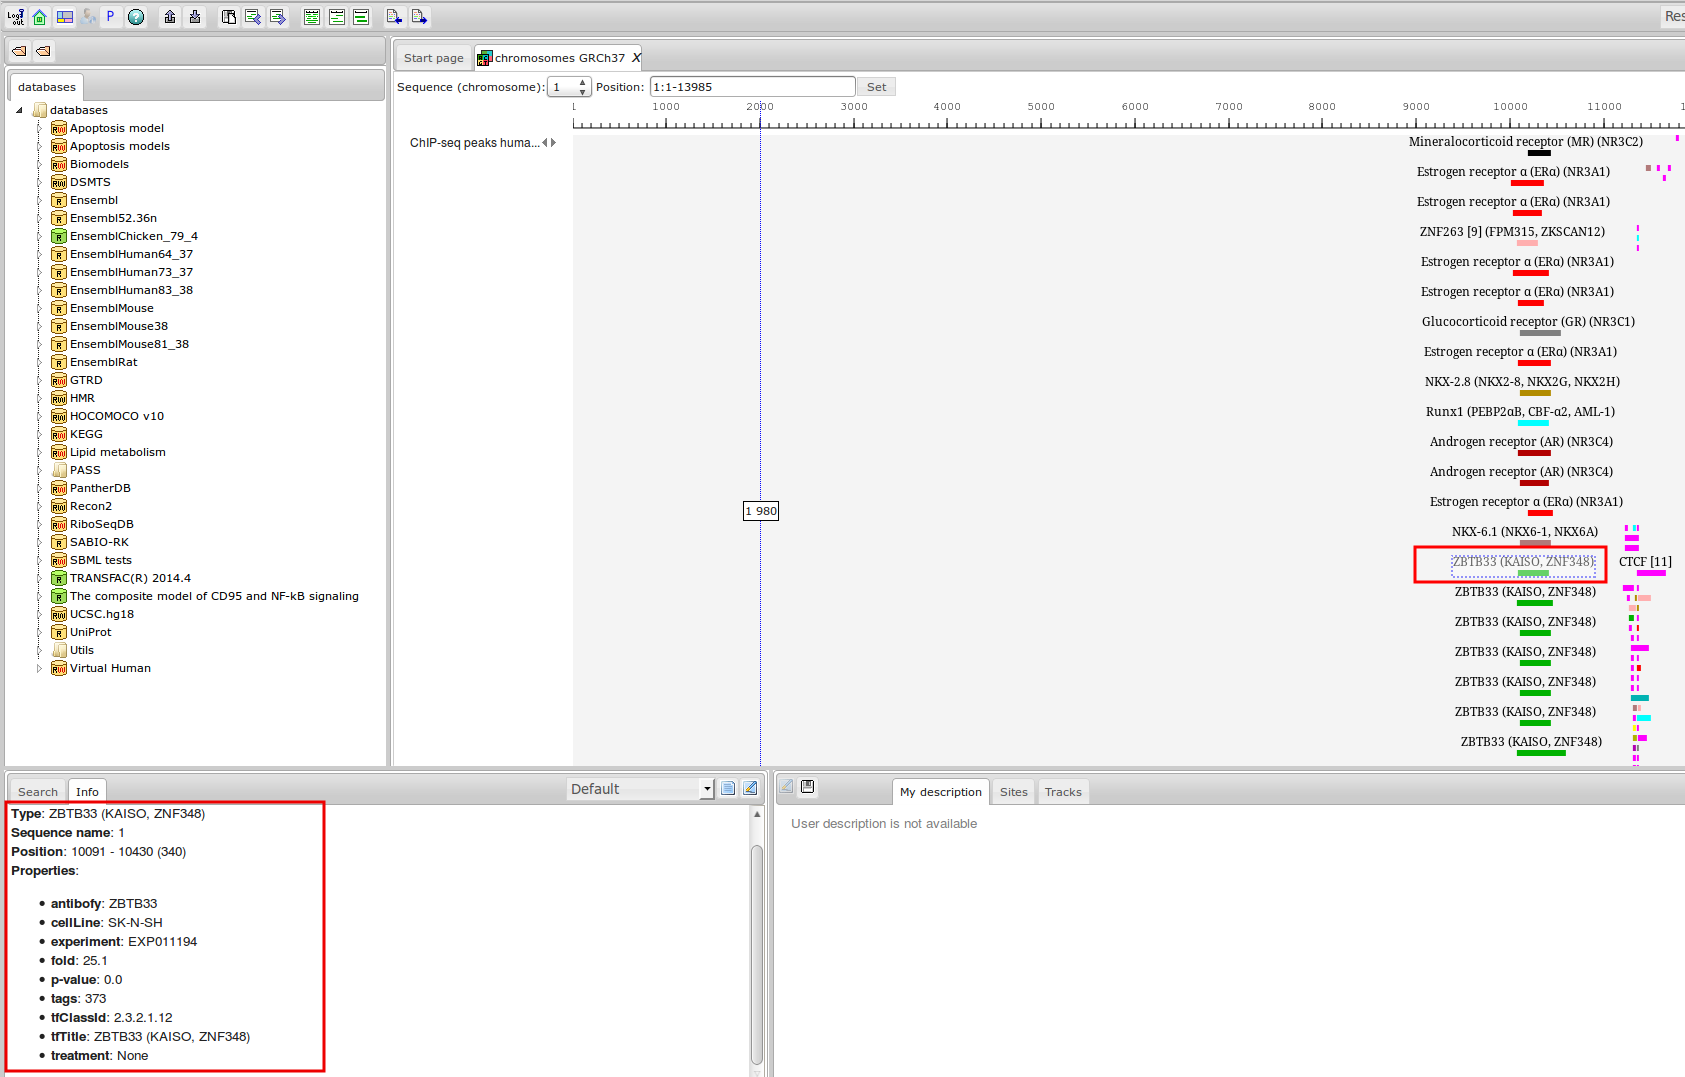
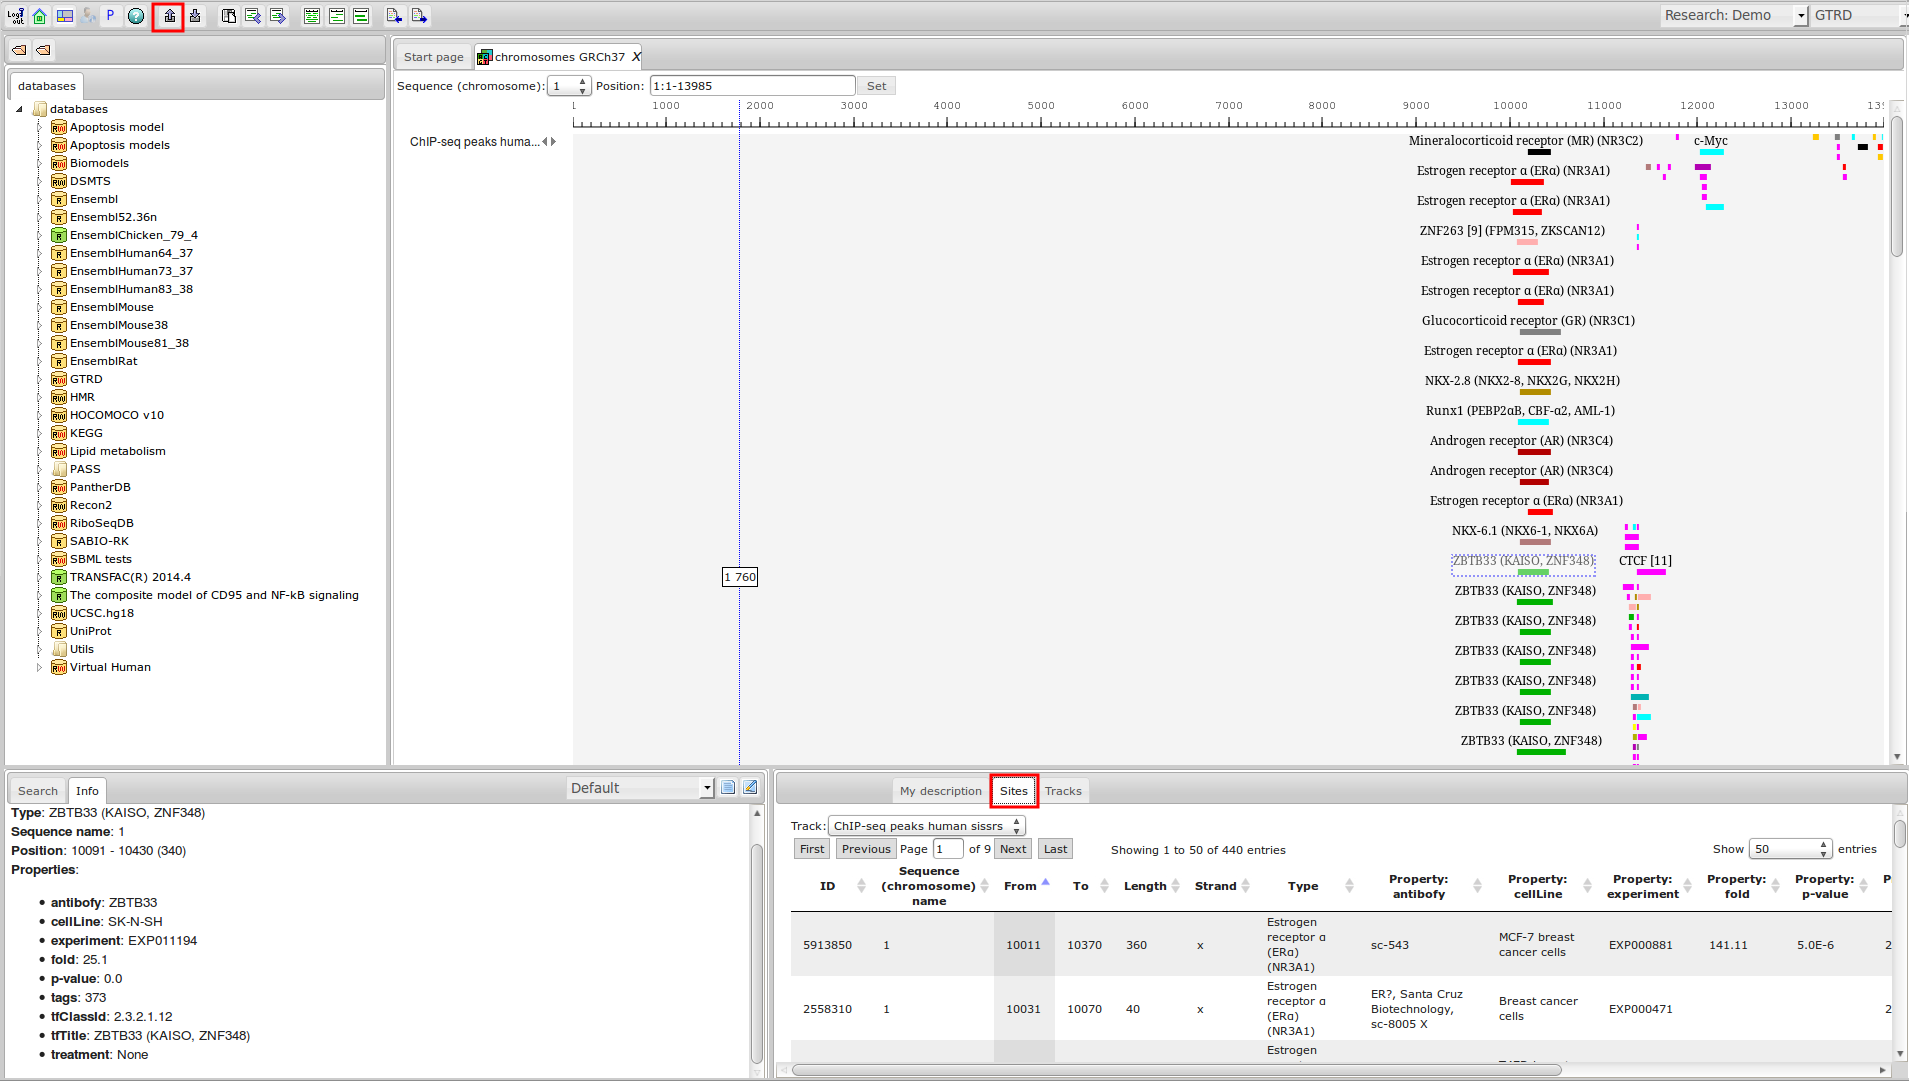
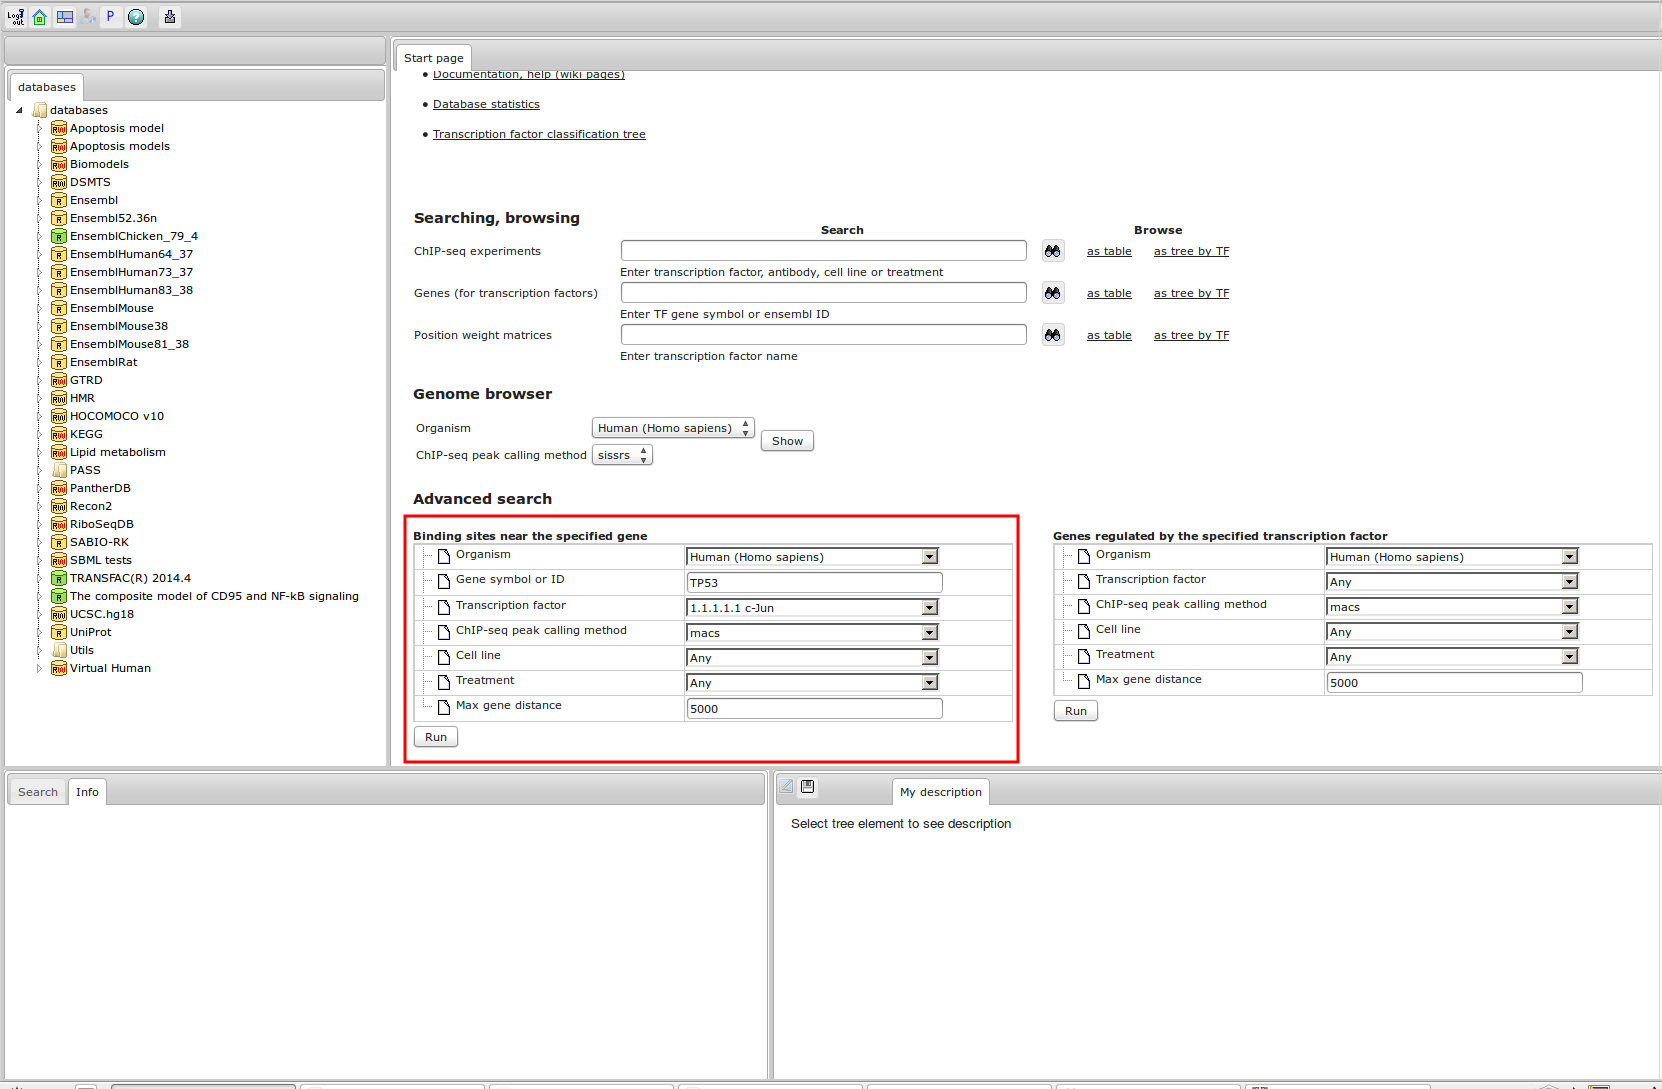
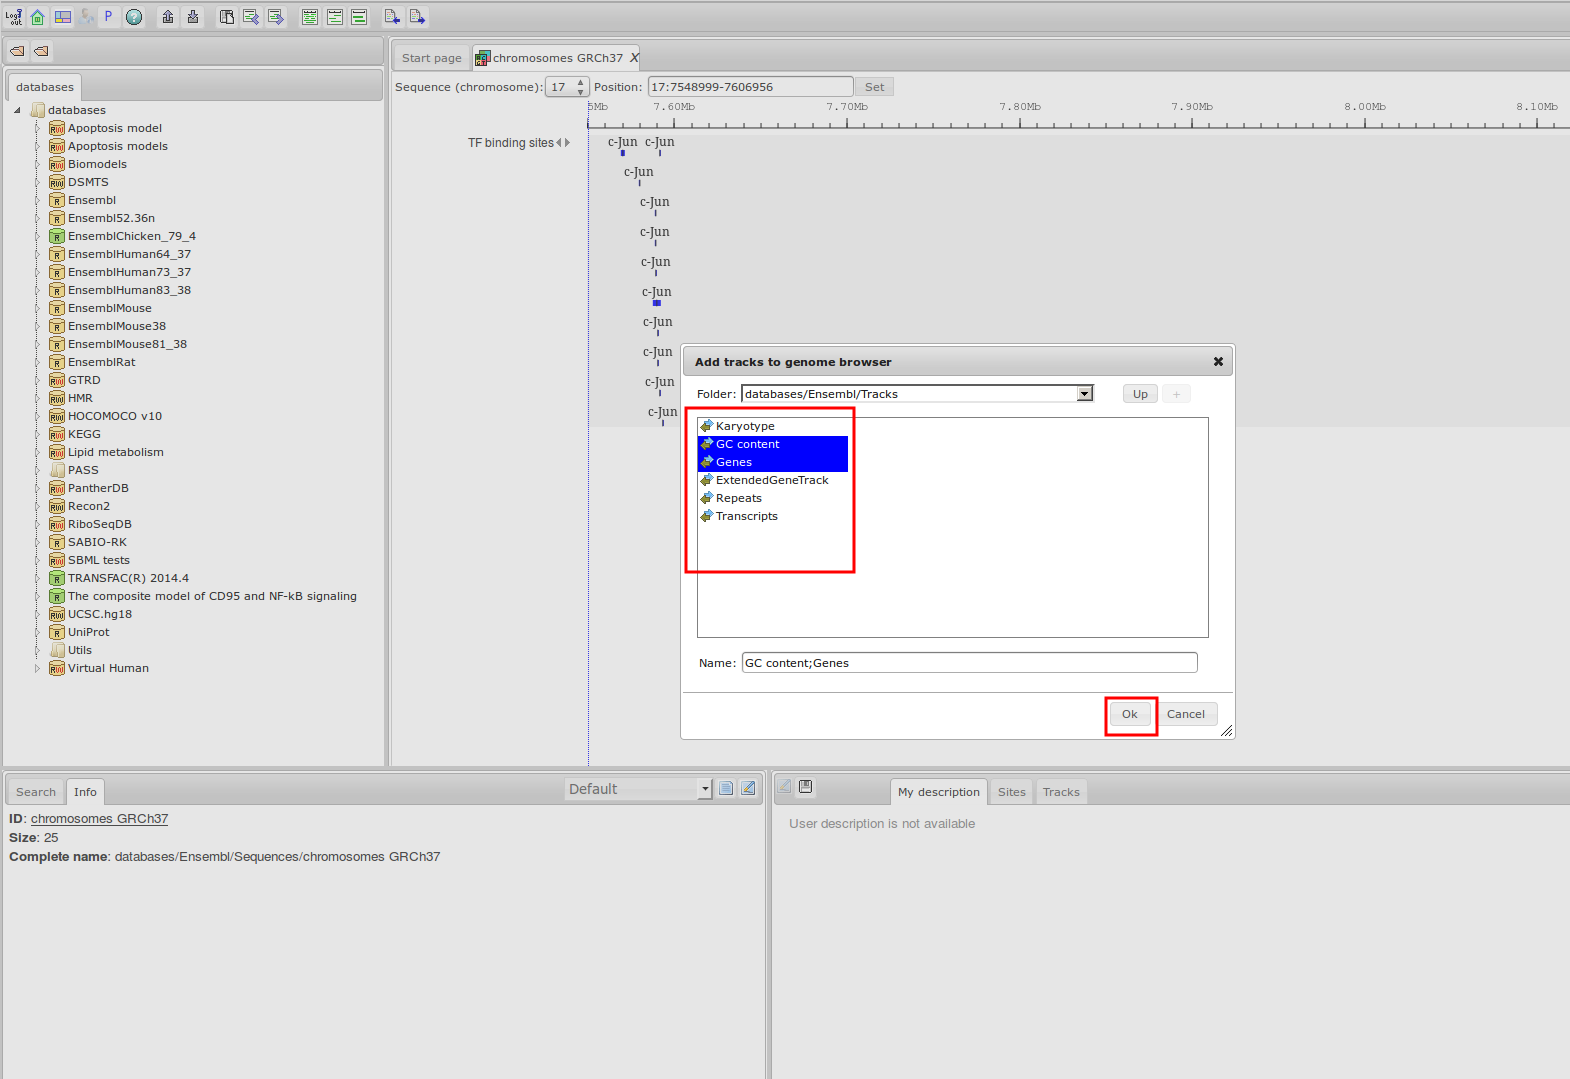
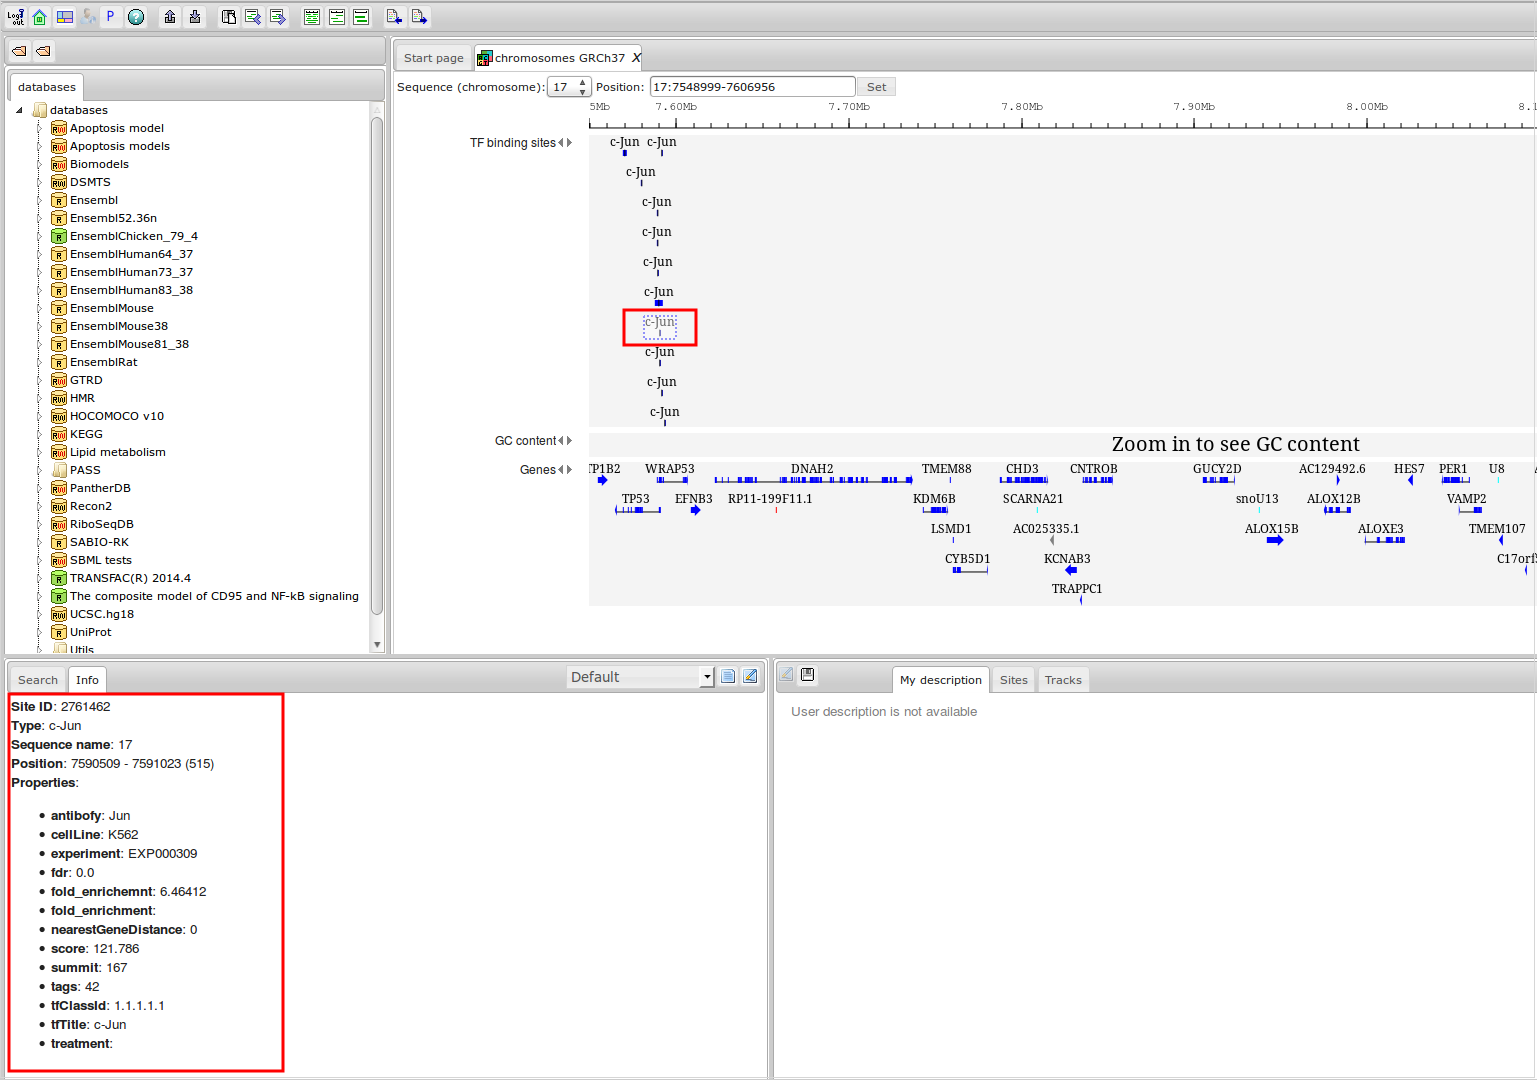
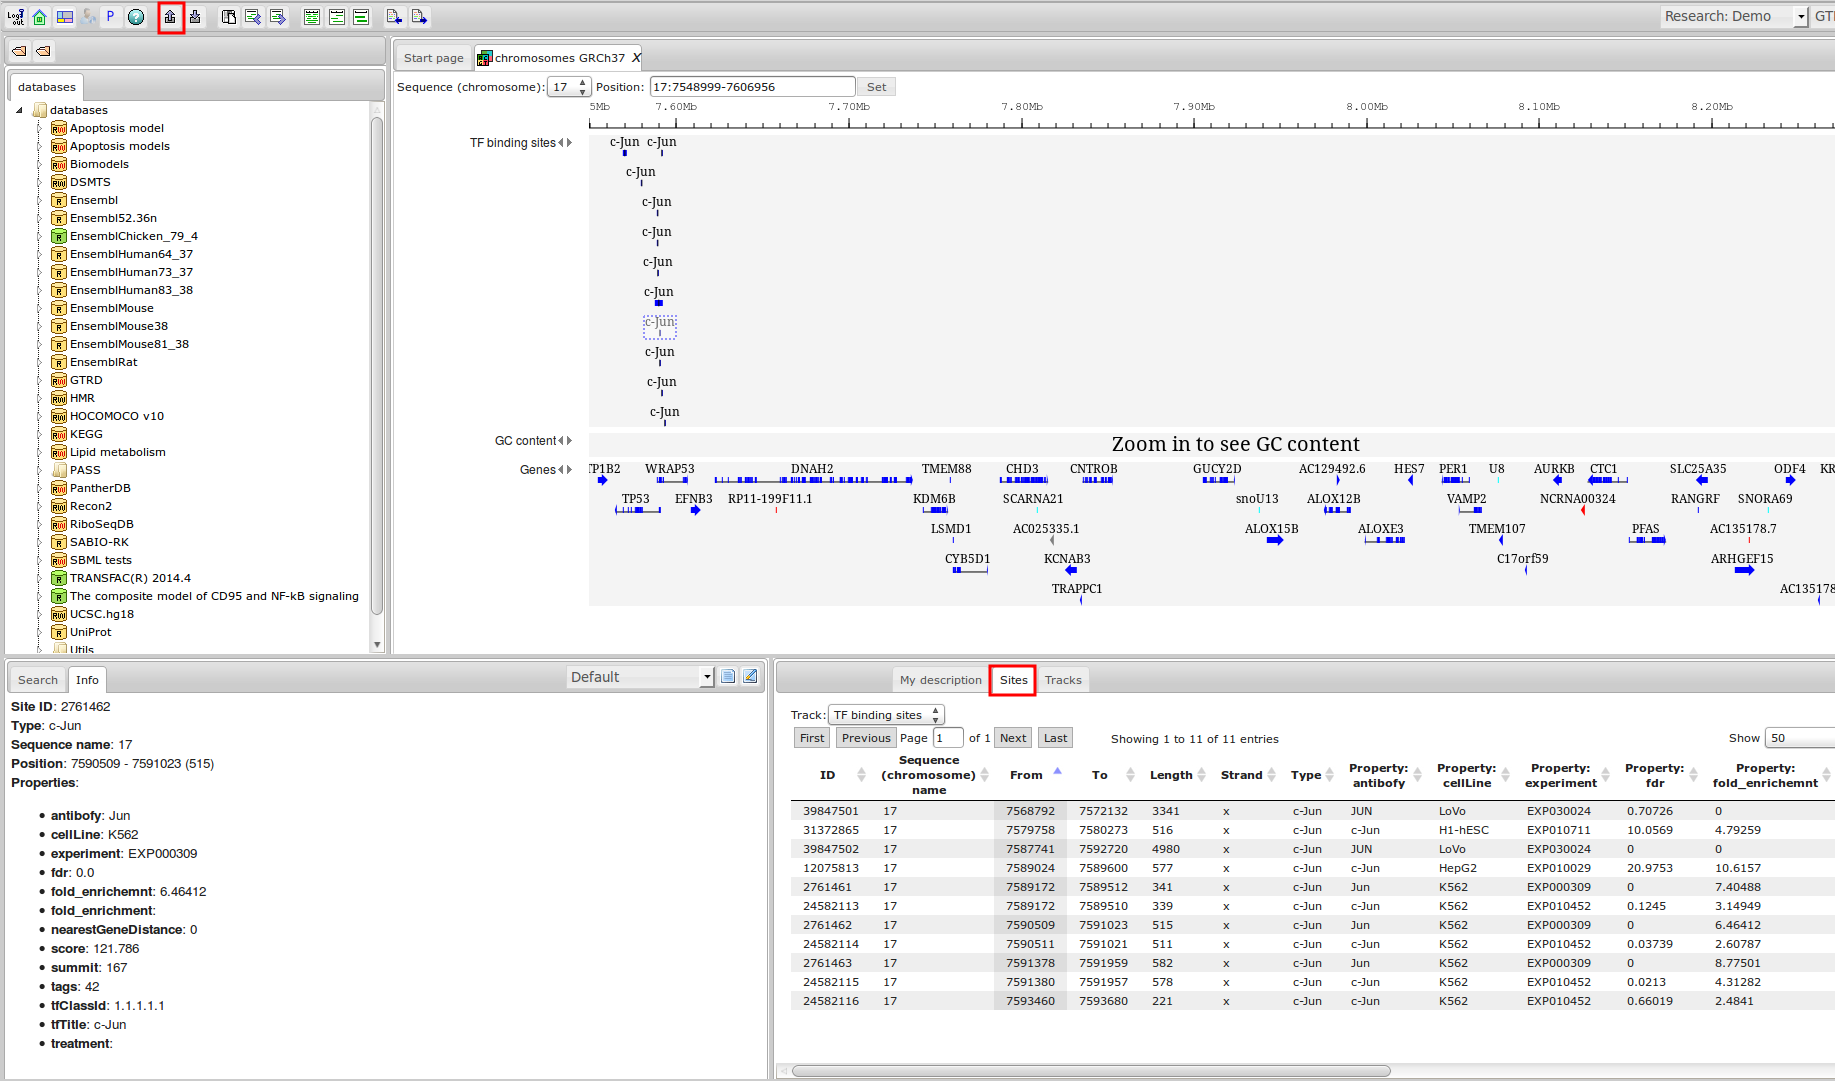
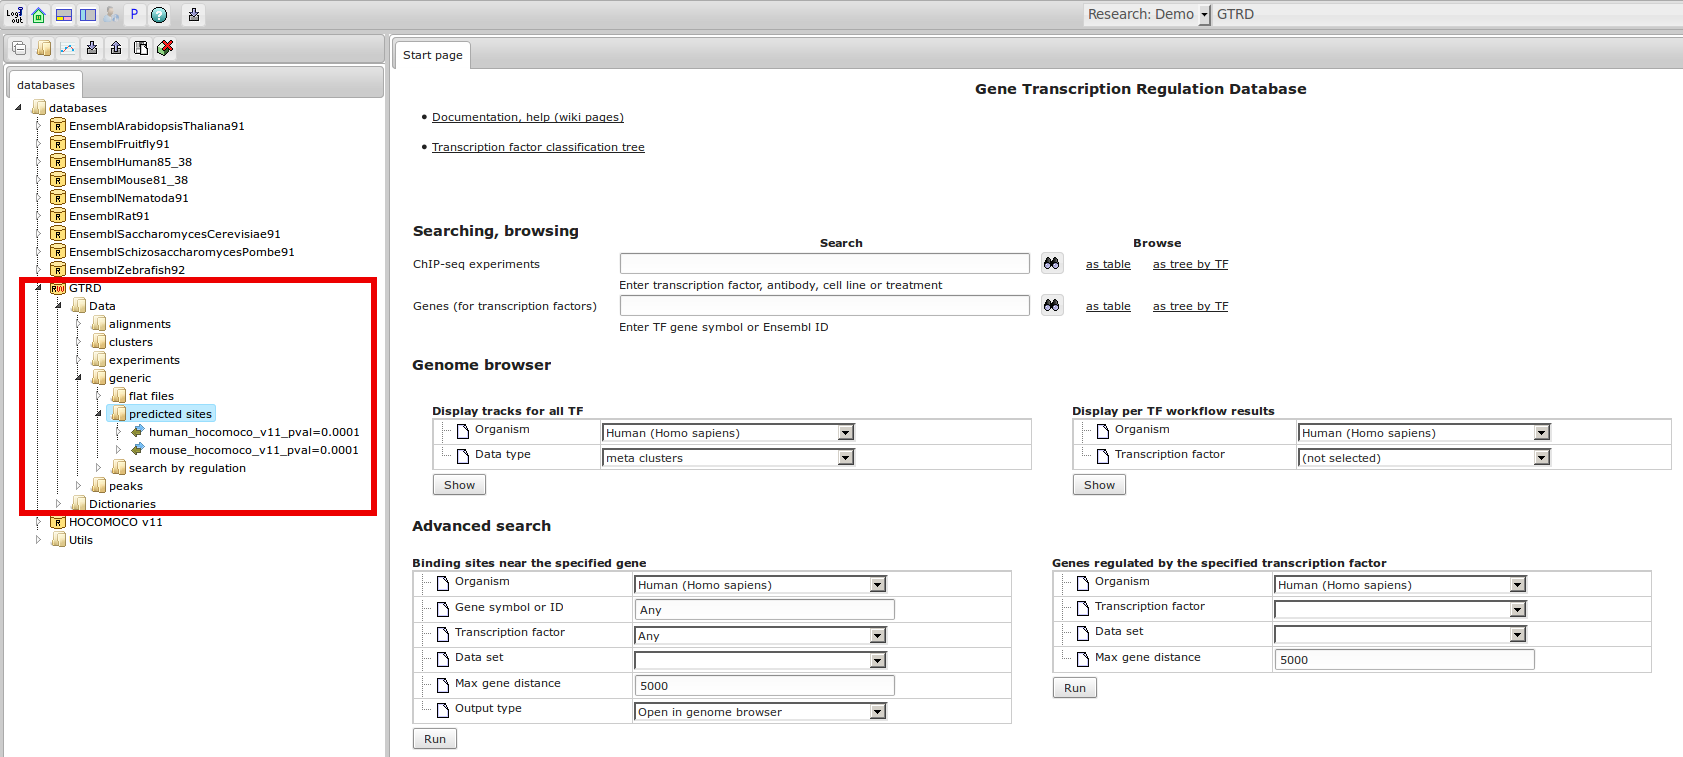
The most complete collection of uniformly processed ChIP-seq data to identify transcription factor binding sites for human and mouse. Convenient web interface with advanced search, browsing and genome browser based on the BioUML platform. For support or any questions contact ivan@dote.ru
Workflow
How was it constructed?
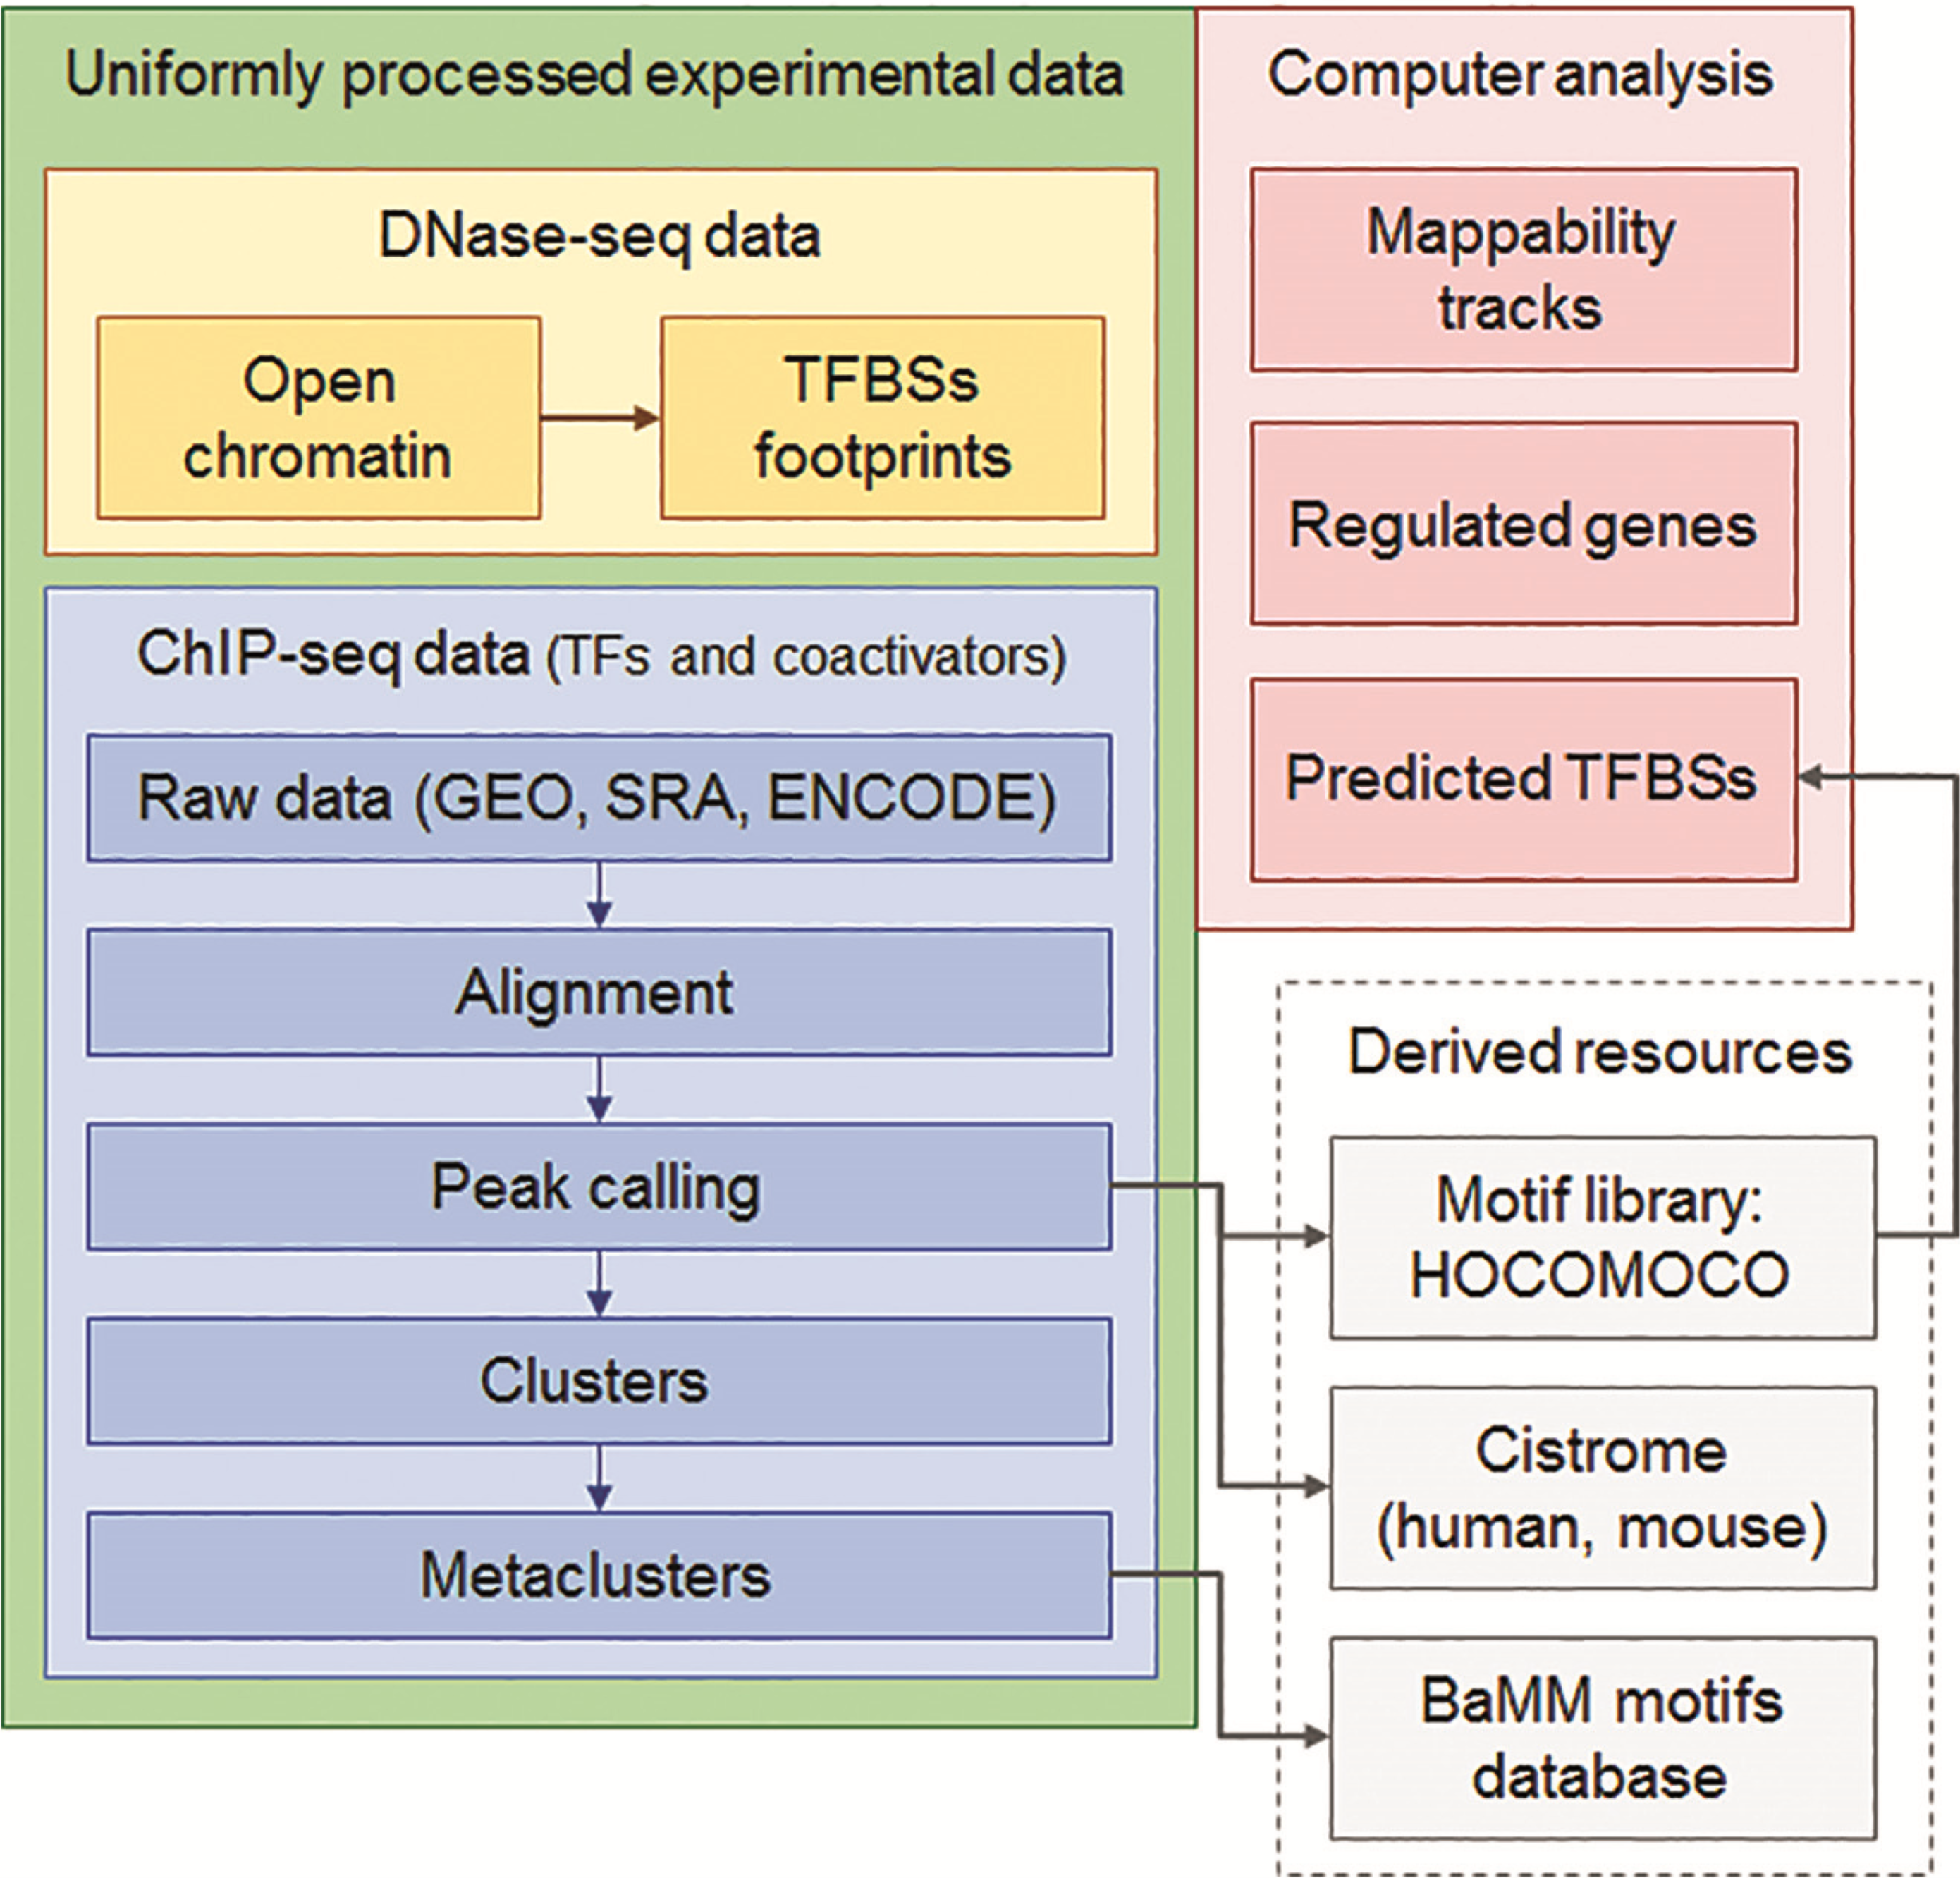
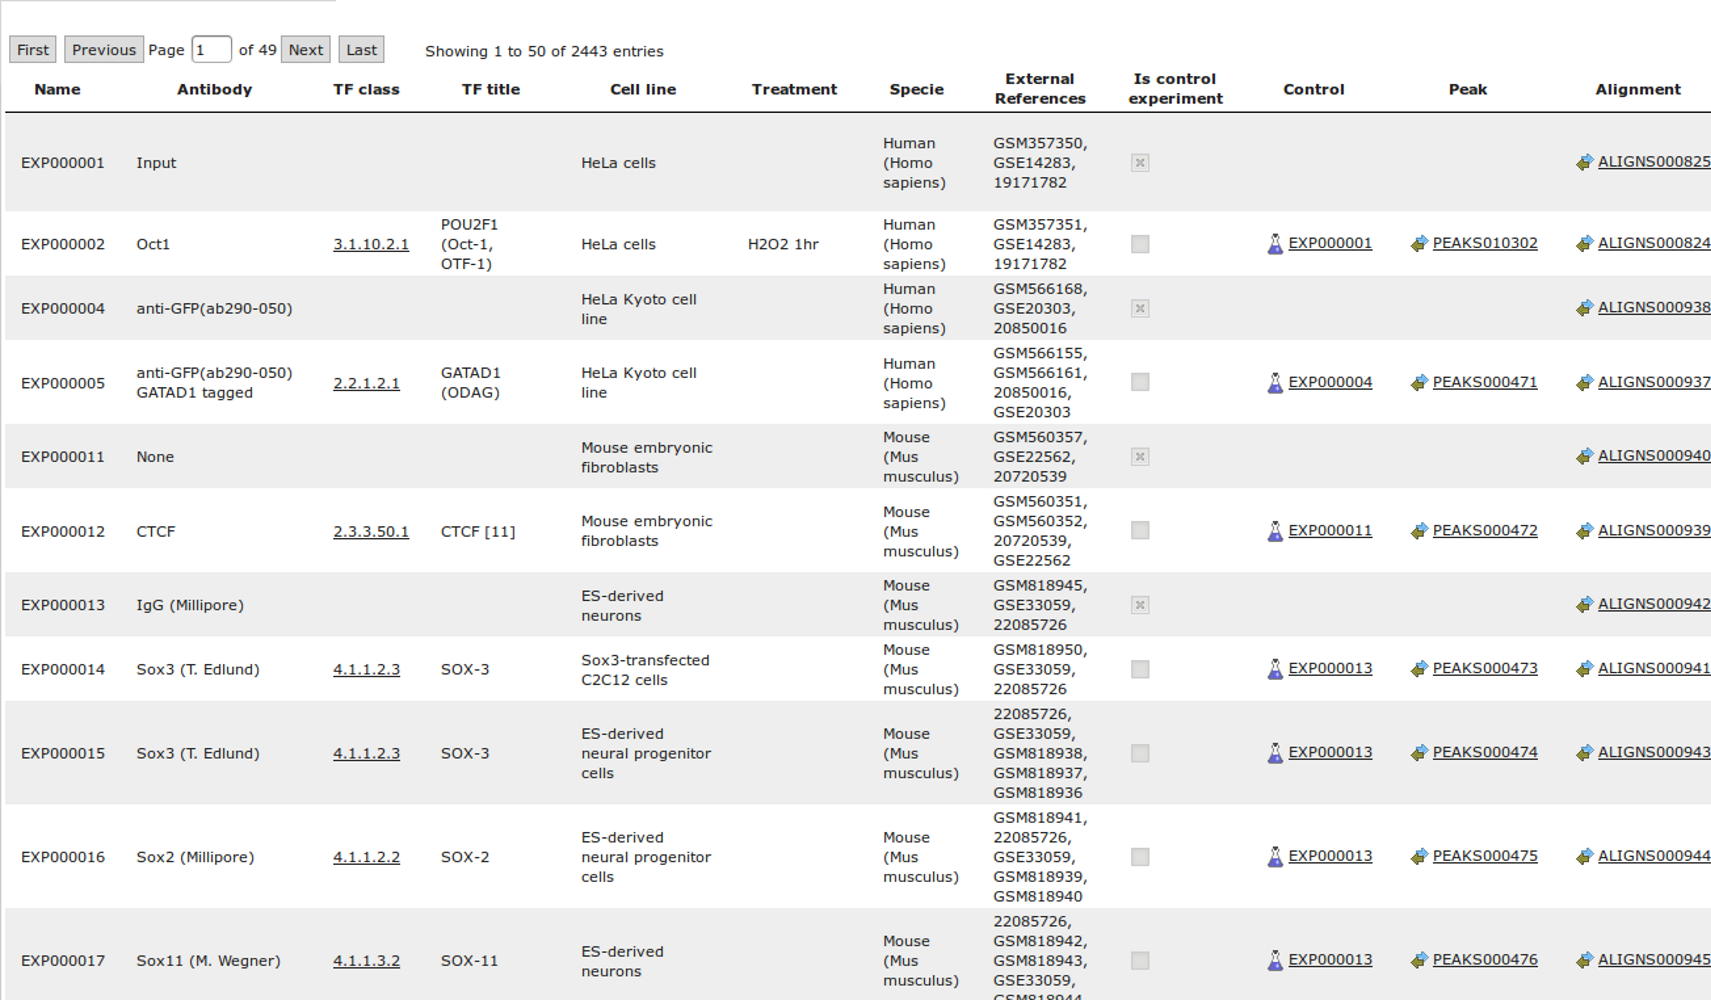
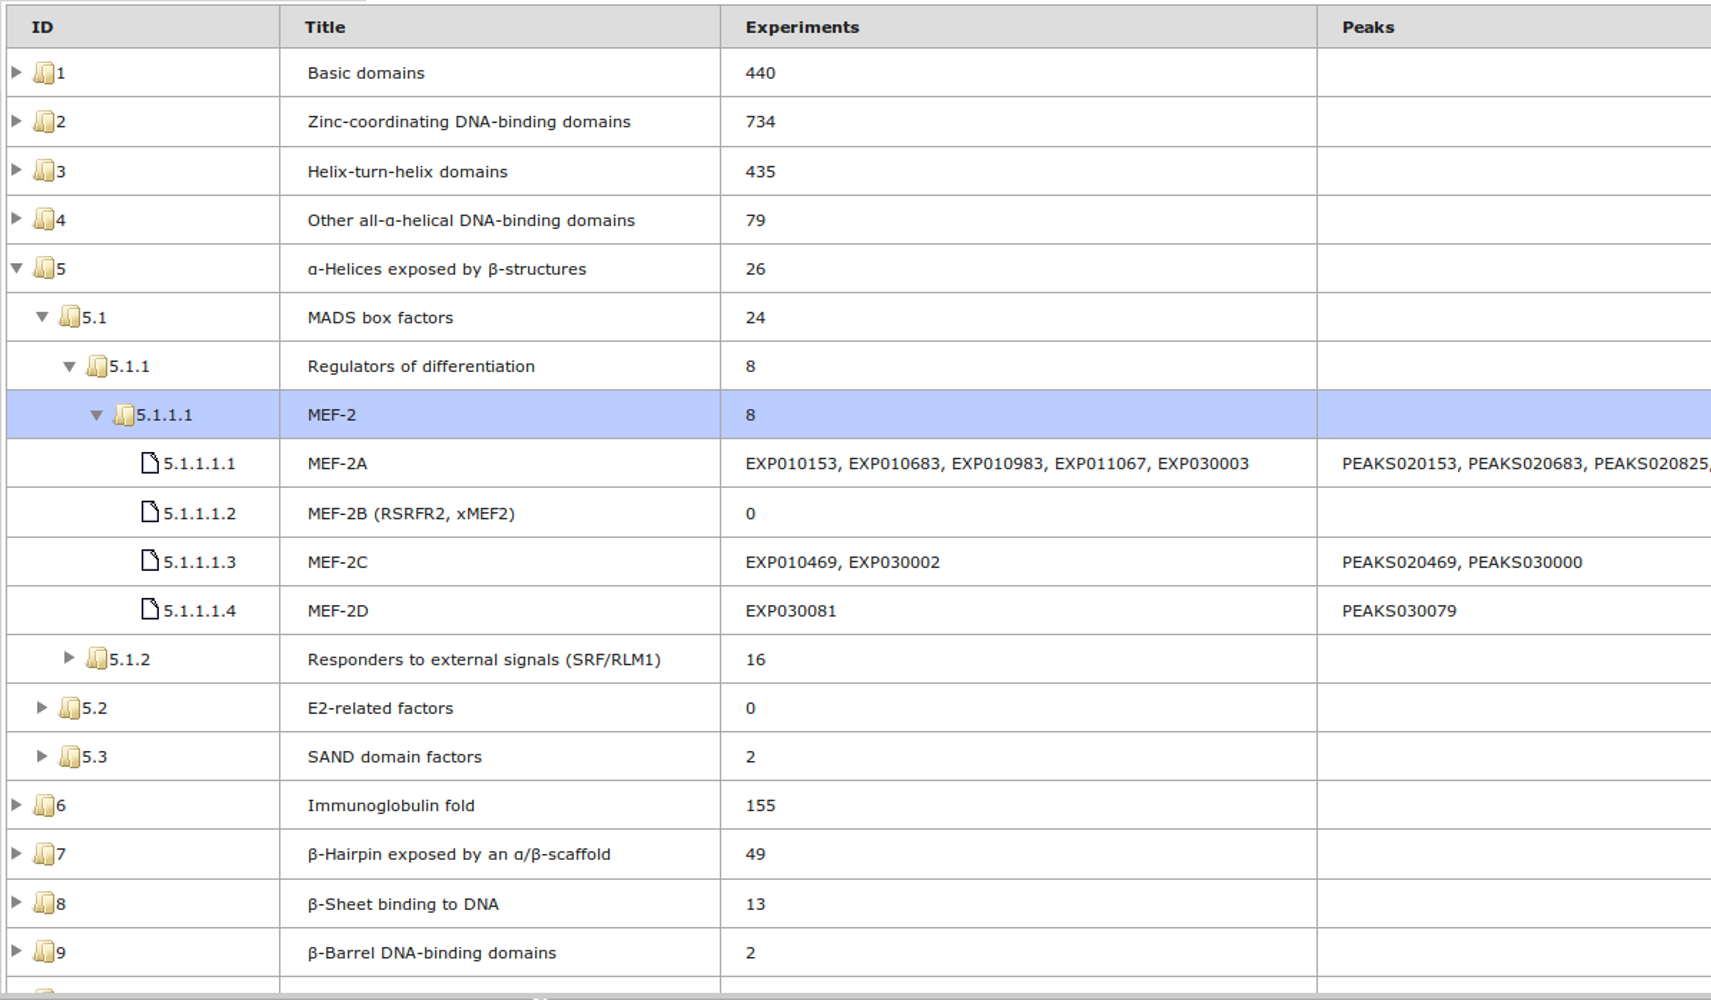
ChIP-seq experiment information and raw data were collected from publically available sources. Sequenced reads were aligned using Bowtie2 and ChIP-seq peaks were called using 4 different methods. Peaks were merged into clusters and metaclusters to produce non-redundant set of transcription factor binding sites.
Learn more »How to cite
License
Users may freely use the GTRD database for non-commercial purposes as long as they properly cite it. If you intend to use GTRD for a commercial purpose, please contact ivan@dote.ru to arrange a license.
Statistics for version 19.10 (version 19.04)
ChIP-seq
| Species | ChIP-seq experiments | Transcription factors | ChIP-seq reads ×109 |
Reads aligned ×109 |
ChIP-seq peaks ×106 |
Clusters ×106 |
Metaclusters ×106 |
|---|---|---|---|---|---|---|---|
| Arabidopsis thaliana | 454 (424) | 124 (120) | 25.3 (24.2) | 15.1 (14.4) | 4.8 (2.9) | 3.8 (2.2) | 0.44 (0.38) |
| Caenorhabditis elegans | 1558 (1508) | 331 (326) | 30.5 (26.6) | 21.5 (19.1) | 6.2 (3.4) | 4.5 (2.4) | 0.5 (0.4) |
| Danio rerio | 55 (51) | 21 (20) | 2.4 (2.1) | 1,2 (1.1) | 2.2 (2.1) | 2.3 (1.9) | 0.28 (0.26) |
| Drosophila melanogaster | 2366 (2182) | 569 (552) | 79.8 (74.4) | 56.8 (53.1) | 19.3 (10.5) | 5.4 (7.4) | 0.7 (1.4) |
| Homo sapiens | 13515 (10675) | 1339 (1158) | 783.0 (616.3) | 606.9 (483.3) | 1102.3 (818) | 703.6 (505.2) | 91.7 (60.5) |
| Mus musculus | 10728 (8055) | 738 (584) | 577.5 (403.4) | 381.9 (273.1) | 943.7 (699.8) | 598.8 (431.6) | 80.8 (56.0) |
| Rattus norvegicus | 187 (153) | 36 (29) | 9.5 (7.5) | 6.1 (4.8) | 11.0 (9.3) | 9.2 (7.6) | 1.4 (1.1) |
| Saccharomyces cerevisiae | 1581 (1364) | 161 (142) | 25.8 (20.3) | 19.2 (15.5) | 1.62 (0.66) | 0.84 (0.3) | 0,056 (0.038) |
| Schizosaccharomyces pombe | 226 (222) | 57 (55) | 3.5 (3.4) | 2.6 (2.6) | 0.249 (0.11) | 0.18 (0.09) | 0.014 (0.011) |
| Total | 30670 (24634) | 3376 (2986) | 1537.3 (1178.3) | 1111.3 (867.1) | 2091.3 (1546.7) | 1328.6 (958.7) | 175.9 (120.1) |
DNase-seq (version 18.06)
| Species | DNase-seq experiments | DNase I hypersensitive sites (DHSs) ×106 |
DNase-seq footprints (FDR<0.01) ×106 |
|---|---|---|---|
| Homo sapiens | 1482 (739) |
|
|
| Mus musculus | 103 (103) |
|
|
| Total | 1585 (842) |
|
|
Studies citing GTRD
- A single ChIP-seq dataset is sufficient for comprehensive analysis of motifs co-occurrence with MCOT package. Nucleic Acids Research, 2019 Sep 17
- Extensive transcriptional responses are co-ordinated by microRNAs as revealed by Exon–Intron Split Analysis (EISA). Nucleic Acids Research, 2019 Aug 2
- The TP53 Apoptotic Network is a Primary Mediator of Resistance to BCL2 inhibition in AML Cells. Cancer discovery, 2019 May 2
- The Dual-Specificity Phosphatase 10 (DUSP10): Its Role in Cancer, Inflammation, and Immunity. Int. J. Mol. Sci., 2019 Apr 1
- Identifying functions and prognostic biomarkers of network motifs marked by diverse chromatin states in human cell lines. Oncogene, 2019 Sep 19
- Genotoxic stress-triggered β-catenin/JDP2/PRMT5 complex facilitates reestablishing glutathione homeostasis. Nature Communications, 2019 Aug 21
- Impact of vitamin D and vitamin D receptor TaqI polymorphism in primary human myoblasts. Endocr Connect., 2019 Jul 29
- Developmental dynamics of lncRNAs across mammalian organs and species. Nature, 2019 Jun 26
- HCP5 is a SMAD3-responsive long non-coding RNA that promotes lung adenocarcinoma metastasis via miR-203/SNAI axis. Theranostics, 2019 Apr 13
- BioUML: an integrated environment for systems biology and collaborative analysis of biomedical data. Nucleic Acids Research, 2019 Jul 2
- Gene expression and DNA methylation as mechanisms of disturbed metabolism in offspring after exposure to a prenatal high fat diet. Journal of lipid research, 2019 May 7
- Molecular Interaction Networks to Select Factors for Cell Conversion. Computational Stem Cell Biology, 2019 May 7
- SEanalysis: a web tool for super-enhancer associated regulatory analysis. Nucleic Acids Research, 2019 Jul 2
- A Novel Set of WNT Pathway Effectors as a Predictive Marker of Uterine Corpus Endometrial Carcinoma–Study Based on Weighted Co-expression Matrices. Front. Oncol., 2019 May 10
- PI3K inhibitors protect against glucocorticoid-induced skin atrophy. EBioMedicine, 2019 Feb 5
- CpG traffic lights are markers of regulatory regions in human genome. BMC Genomics, 2019 Feb 1
- Chronic Inflammation in Response to Injury: Retention of Myeloid Cells in Injured Tissue Is Driven by Myeloid Cell Intrinsic Factors. Journal of Investigative Dermatology, 2019 Jan 28
- EnhancerDB: a resource of transcriptional regulation in the context of enhancers. Database, 2019 Jan 24
- The Third Intron of IRF8 Is a Cell-Type-Specific Chromatin Priming Element during Mouse Embryonal Stem Cell Differentiation. Journal of molecular biology, 2019 Jan 18
- ERRα promotes breast cancer cell dissemination to bone by increasing RANK expression in primary breast tumors. Oncogene, 2018 Nov 26
- ChIP-Atlas: a data-mining suite powered by full integration of public ChIP-seq data. EMBO Rep. 2018 Nov 9
- Inference of tumor cell-specific transcription factor binding from cell-free DNA. Preprint. October 2018
- Genome-wide map of human and mouse transcription factor binding sites aggregated from ChIP-Seq data. BMC Res Notes. 2018 Oct 23
- MethMotif: an integrative cell specific database of transcription factor binding motifs coupled with DNA methylation profiles. Nucleic Acids Research. 31 October 2018.
- Characterization of transcriptome transition associates long noncoding RNAs with glioma progression. Molecular Therapy - Nucleic Acids. October 2018.
- An Evolutionarily Conserved Mesodermal Enhancer in Vertebrate Zic3. Scientific Reports. December 2018.
- Introductory Chapter: A Brief Overview of Transcriptional and Post-transcriptional Regulation. In book: Transcriptional and Post-transcriptional Regulation. October 2018.
- Contributions of regulated transcription and mRNA decay to the dynamics of gene expression. Wiley Interdiscip Rev RNA. 2018 Oct.
- A map of direct TF-DNA interactions in the human genome Preprint 2018.
- Disentangling transcription factor binding site complexity. Nucleic Acids Research. August 2018.
- TFmapper : A Tool for Searching Putative Factors Regulating Gene Expression Using ChIP-seq Data. Int J Biol Sci 2018.
- Endolysosomal degradation of Tau and its role in glucocorticoid‐driven hippocampal malfunction. EMBO J. 2018 Oct 15.
- snpEnrichR: analyzing co-localization of SNPs and their proxies in genomic regions. Bioinformatics. 2018 Jun 7.
- Detecting genome-wide directional effects of transcription factor binding on polygenic disease risk. Nature Genetics. September 2018
- Rapid and Efficient FISH using Pre-Labeled Oligomer Probes. Sci Rep. 2018 May 29;8(1):8224.
- Rapamycin Modulates Glucocorticoid Receptor Function, Blocks Atrophogene REDD1, and Protects Skin from Steroid Atrophy. J Invest Dermatol. 2018 Sep;138(9):1935-1944.
- Identifying transcription factor Olig2 genomic binding sites in acutely purified PDGFRα+ cells by low-cell chromatin immunoprecipitation sequencing analysis. J Vis Exp. 2018 Apr 16;(134).
- Functional interplay between c-Myc and Max in B lymphocyte differentiation. EMBO Rep. 2018 Aug 20.
- Genome-Wide Scanning of Gene Expression. Reference Module in Life Sciences. 2018
- Multi-omic Directed Networks Describe Features of Gene Regulation in Aged Brains and Expand the Set of Genes Driving Cognitive Decline Front. Genet., 09 August 2018
- Analysis of diet-induced differential methylation, expression, and interactions of lncRNA and protein-coding genes in mouse liver. Sci Rep. 2018 Aug 1;8(1):11537.
- Systems analysis of dilated cardiomyopathy in the next generation sequencing era. Wiley Interdiscip Rev Syst Biol Med. 2018 Jul
- Hypoxia and serum deprivation induces glycan alterations in triple negative breast cancer cells. Biol Chem. 2018 Jun 27
- Hormone-responsive genes in the SHH and WNT/β-catenin signaling pathways influence urethral closure and phallus growth. Biol Reprod. 2018 May 14.
- The BaMM web server for de-novo motif discovery and regulatory sequence analysis. Nucleic Acids Research, 28 May 2018
- Transcription Factor Databases. Reference Module in Life Sciences. 2018
- Core signaling pathways in ovarian cancer stem cell revealed by integrative analysis of multi-marker genomics data. PLoS One. 2018 May 3.
- Computational master-regulator search reveals mTOR and PI3K pathways responsible for low sensitivity of NCI-H292 and A427 lung cancer cell lines to cytotoxic action of p53 activator Nutlin-3. BMC Medical Genomics, 13 February 2018.
- MnSOD/SOD2 in Cancer: The Story of a Double Agent. Reactive Oxygen Species, Feb 2018.
- The Role of Indoleamine-2,3-Dioxygenase in Cancer Development, Diagnostics, and Therapy. Front. Immunol., 31 January 2018
-
Eukaryotic and prokaryotic promoter databases as valuable tools in exploring the regulation of gene transcription: a comprehensive overview.
Gene. 2017 Nov 2. -
HOCOMOCO: towards a complete collection of transcription factor binding models for human and mouse via large-scale ChIP-Seq analysis.
Nucleic Acids Res. 2017 Nov 11. - ReMap 2018: an updated atlas of regulatory regions from an integrative analysis of DNA-binding ChIP-seq experiments Nucleic Acids Res. 2017 Nov 8.
- DMS-Seq for In Vivo Genome-wide Mapping of Protein-DNA Interactions and Nucleosome Centers. Cell Reports 2017 Oct 3;21(1):289-300.
- EpiDenovo: a platform for linking regulatory de novo mutations to developmental epigenetics and diseases. Nucleic Acids Research 2017, gkx918
- Genetic variants in ADAMTS13 as well as smoking are major determinants of plasma ADAMTS13 levels. Blood Advances 2017 1:1037-1046;
- Master-regulators driving resistance of non-small cell lung cancer cells to p53 reactivator Nutlin-3. Virtual Biology 2017, 0(4), 1-31.
- Discovering relationships between nuclear receptor signaling pathways, genes, and tissues in Transcriptomine. Sci Signal. 2017 Apr 25;10(476).
- A comprehensive review of web-based non-coding RNA resources for cancer research. Cancer Lett. 2017 Aug 18;407:1-8.
- RUNX1 promote invasiveness in pancreatic ductal adenocarcinoma through regulating miR-93. Oncotarget 2017 Aug 24